Call center leaders are constantly challenged to make optimal decisions on issues such as resource allocation, agent training, and business processes. Operating blindly is simply not an option. That’s why collecting solid, reliable metrics is essential to customer success.
Bright Pattern, leading provider of cloud call center software, understands that call center KPIs, call center metrics, and customer expectations have changed. That’s why we enable you to measure customer success through tailored call center metrics that span all aspects of the customer experience (CX) and call center performance.
Call Center Key Performance Indicators (KPIs) and Call Center Metrics are statistics (e.g., averages, percentages, totals, etc.) that pull data that are used to measure the status of your call center operations. There are many different kinds of metrics, and all metrics provide important insights for your organization. In recent years, however, metrics that are more customer experience- or revenue-focused have moved to the forefront. Per Gartner and other industry analysts, great customer experience is now a key differentiator and a top focus area of CEOs. Cost-focused metrics are still important, but companies now see brand representation and revenue generation—instead of cost reduction—as the primary focus of call centers and contact centers.
What are the most important call center metrics you need to consider collecting? Although there are dozens of metrics that make sense in any given inbound call center or contact center, we have listed the top CX metrics that should be on every customer service leader’s list.
For clarity, these top call center metrics are divided into two groups: those that measure the quality of the customer experience and support business growth, and those that measure efficiency and support cost savings. In practice, each of these two types of call center reporting metrics plays an essential role in measuring your progress toward key business goals.

CUSTOMER EXPERIENCE METRICS
Customer experience metrics gauge how customers assess their experience with a service interaction, a product, or your company overall. They allow you to measure progress toward key business goals, such as improved retention, higher customer loyalty, and greater average lifetime customer spend.
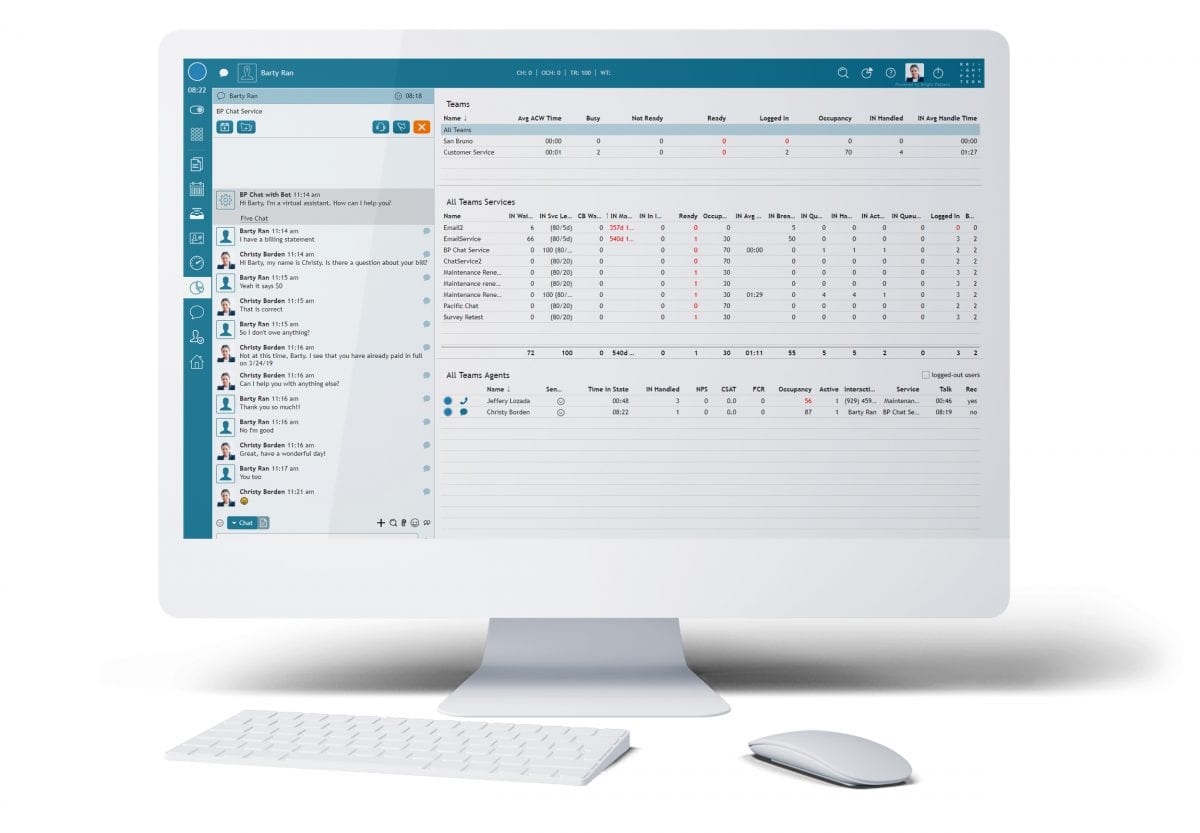
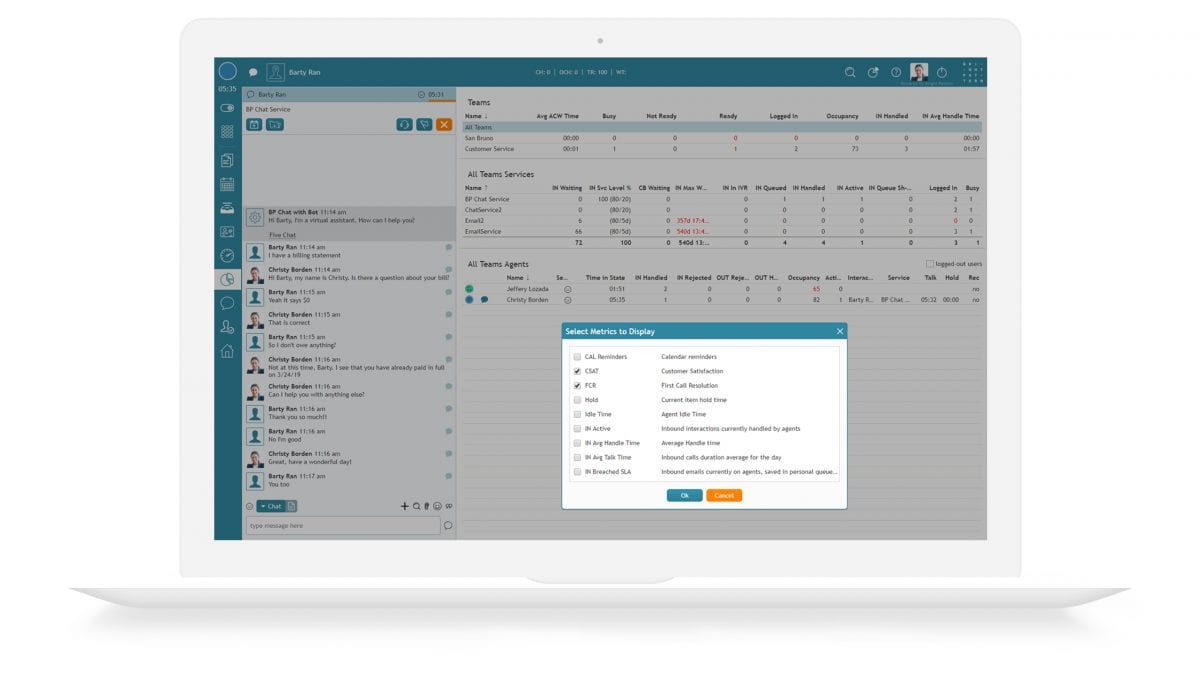
When implemented correctly, these metrics allow you to measure progress toward providing a true omnichannel customer experience. Bright Pattern makes it easy to track these call center metrics across all contact channels, through various stages of the customer journey, and across agent pools, in order to ensure maximum effectiveness. Our omnichannel Agent Desktop and robust quality management features enable supervisors, agents, and quality evaluators to gauge customer experience in real-time throughout each interaction, as well as after the fact, via dashboards, wallboards, and historical reports. Tracking the following customer experience metrics allows you to measure progress toward providing effortless and personal omnichannel customer service.
CSAT
Customer Satisfaction (CSAT) provides a numerical score indicating how satisfied a customer is with a particular interaction, service, or product. A CSAT score is arrived at by conducting a survey to assess how a customer rates their experience. This metric is one of the most commonly used, as it’s highly versatile and allows you to ask a wide range of questions. CSAT has also been shown to be directly related to the market valuation of a company. Studies by the American Customer Satisfaction Index show that companies that beat their peers in CSAT typically have market valuations 40–100% greater than their competitors. Agent satisfaction is a related metric that many companies now measure, too, as they realize that happy agents lead to happy customers.
CES
Customer Effort Score (CES) gauges how much effort a customer needs to exert in order to have their inquiries resolved by a company. The benefit of calculating this metric is it allows you to identify any barriers to providing great customer service. A low score indicates that customers find your company easy to deal with—a finding that correlates with high customer loyalty.
NPS
Net Promoter Score (NPS) is calculated by asking a single question: “How likely is it that you would recommend our product or service to a friend?” Customers rate on a scale from 1 to 10, where 0 means “not at all likely,” and 10 means “extremely likely.” Based on their responses, customers are then placed into three categories: detractors, passives, and promoters. NPS has become a top metric for call centers and contact centers.
SENTIMENT
Sentiment or how a customer is “feeling” about an interaction is a newer metric that is now being measured by AI and other methods automatically in real-time at different points in a customer interaction. Sentiment can be measured over various channels such as voice, chat, email, text via Natural Language Understanding (NLU) or Natural Language Processing (NLP).
The key to measuring customer success, call center metrics provide important insights on the customer experience, call center performance, and efficiency. With the Bright Pattern cloud call center platform, you can measure your progress toward key business goals by collecting and analyzing the customer experience through real-time and historical call center metrics.
[/ultimate_heading][ult_buttons btn_title=”GET MORE INFO NOW” btn_link=”url:https%3A%2F%2Fwww.brightpattern.com%2Frequest-a-demo%2F|title:request%20a%20demo||” btn_align=”ubtn-center” btn_title_color=”#ffffff” btn_bg_color=”#ff9b05″ btn_hover=”ubtn-center-dg-bg” btn_bg_color_hover=”#ff9b05″ btn_title_color_hover=”#ffffff” icon=”Defaults-eye” icon_size=”32″ icon_color=”#ffffff” btn_icon_pos=”ubtn-sep-icon-right-push” btn_border_style=”solid” btn_color_border=”#ff9b05″ btn_color_border_hover=”#ff9b05″ btn_border_size=”2″ btn_radius=”0″ btn_font_size=”desktop:18px;” btn_font_style=”font-weight:bold;”]
CALL CENTER PERFORMANCE METRICS
Operational efficiency metrics measure the efficiency of your contact center operations. The scores obtained from these metrics indicate how effectively your contact center is allocating resources and containing costs.
CHANNEL MIX
Channel mix is a percentage of interactions for each channel.
INTERACTION MIX
Related to Channel Mix is the Percentage of Interactions by Journey Type (e.g. Sales vs Support), Customer Segment (Gold vs Bronze).
FCR
First Call (or contact) Resolution (FCR) calculates the percentage of customer issues that are resolved by the contact center without requiring follow-up. This call center metric gauges both customer satisfaction and contact center agent efficiency, both of which are closely aligned with containing costs. FCR can be useful for omnichannel operations, as this metric can be measured and compared across multiple channels. For example, web chat may be found to offer higher FCR rates than email.
AHT
Average Handle Time (AHT) is the average amount of time an agent spends handling customer issues or transactions. This metric also gauges the total time that a customer spends from initial call/chat/email/social message until their issue is resolved. This includes not only the time spent with an agent, but any wait time as well.
FRT AND LHT
A call center performance metric related to AHT is First Response Time (FRT) – the average time a customer must wait until connecting with an agent across any channel. Companies may also want to track a related metric, the Longest Hold Time (LHT).
SLA
Service Level Agreement (SLA) tracks the organization’s success in answering a specific number of calls within a specified number of seconds, as contractually agreed upon. The precise number is a key performance indicator (KPI) as determined by the SLA. Contact center teams typically monitor SLA scores in the customer service software dashboard so they can make real-time, data driven decisions that allow them to meet team targets.
AWC
Another important call center metric is the number of Active Waiting Calls (or chats, texts, etc) (AWC). This can indicate how effectively different channel queues are performing and indicated if a change in skill allocation of the workforce is needed to better address certain channels or if the size of the workforce is adequate to address customer demands.
CALLS HANDLED OR INTERACTION ARRIVAL RATE
A related metric to AWC is Calls or Interactions Handled in a given period of time.
PEAK TRAFFIC
Related to Calls or Interactions Handled is the Peak Traffic for a given channel.
% CALLS (OR INTERACTIONS) ABANDONED
Percentage of Calls Abandoned measures what percentage of calls to the service center were ultimately abandoned by the customer. This metric gauges how adequately the center is staffed, and it measures how wait times are impacting customer frustration levels.
AGENT OCCUPANCY
Agent Occupancy measures the amount of time agents spend answering or directly handling calls. Low occupancy can indicate overstaffing and high operational costs.
ASA
Average Speed of Answer (ASA) is the average time it takes for calls or other interactions to be answered in the call center during a specific time frame. It includes the time the customer spends waiting, but it does not include the time the customer spends in the IVR system.
COST PER CALL OR INTERACTION
Cost Per Call determines how much each call or interaction costs your call center by taking into account all the expenses associated with running a call center (e.g., fixed and variable operational costs, wages, etc.). This call center metric also measures how efficient your call center operation is overall.

We are happy to answer questions, discuss specific workflows and requirements on a live presentation online, describe core benefits, or set up a pilot project to trial our applications without paying any license fees. Let Bright Pattern’s call center solution help you change the pattern of customer service
[/ultimate_heading][ult_buttons btn_title=”GET MORE INFO NOW” btn_link=”url:https%3A%2F%2Fwww.brightpattern.com%2Frequest-a-demo%2F|title:request%20a%20demo||” btn_align=”ubtn-center” btn_title_color=”#ffffff” btn_bg_color=”#ff9b05″ btn_hover=”ubtn-center-dg-bg” btn_bg_color_hover=”#ff9b05″ btn_title_color_hover=”#ffffff” icon=”Defaults-eye” icon_size=”32″ icon_color=”#ffffff” btn_icon_pos=”ubtn-sep-icon-right-push” btn_border_style=”solid” btn_color_border=”#ff9b05″ btn_color_border_hover=”#ff9b05″ btn_border_size=”2″ btn_radius=”0″ btn_font_size=”desktop:18px;” btn_font_style=”font-weight:bold;”]